How to Reduce Customer Churn | Detecting Non-Voluntary Churn Early Through Conversation Intelligence
How to Reduce Customer Churn | Detecting Non-Voluntary Churn Early Through Conversation Intelligence
Every B2B enterprise tracks voluntary churn—the explicit, painful moment an account logs a cancellation request or jumps to a competitor. Because it is loud and definitive, it is easy to build a post-mortem around.
But there is a far more insidious, silent leak in your revenue engine: non-voluntary churn.
In traditional SaaS circles, non-voluntary churn is routinely misdiagnosed as simple transactional billing failure. But for relationship-led firms, managed services, and complex B2B ecosystems, true non-voluntary churn is an architectural pipeline failure. It happens when critical communication state is dropped, stakeholder connection maps dissolve, or institutional context is lost during team handoffs.
The customer didn't necessarily want to leave; your data infrastructure simply allowed the relationship to decay in an unstructured black box. To stop this leakage, leadership must move past surface-level logging and deploy dedicated customer conversation intelligence to reduce churn.
What the Data Shows: The Anatomy of a Decaying Account
After analyzing patterns across 3 million customer conversations spanning Slack, WhatsApp, and email, a consistent pattern emerged: Churn is rarely a sudden decision.
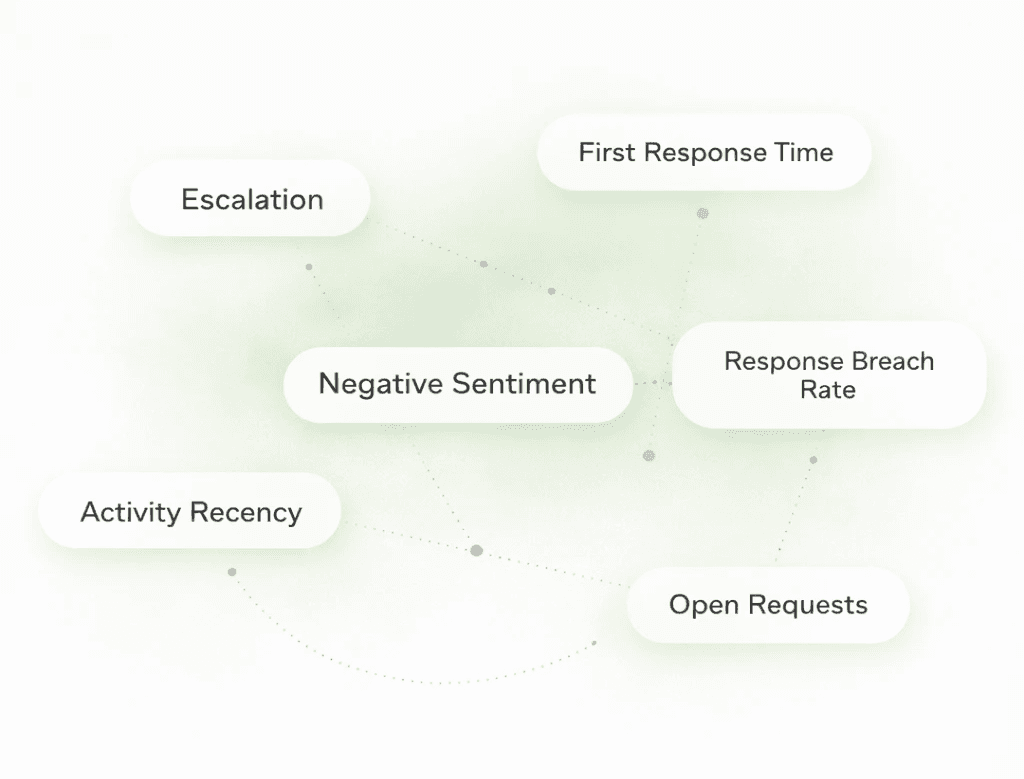
It appears first as coordination friction inside everyday conversations, often weeks before a formal churn discussion begins. Communication behavior often shifts in measurable ways:
Increased follow-up frequency: Clients sending pings because internal state hasn't moved.
Escalation language: The appearance of phrases like "critical," "urgent," or "blocker."
Latency drift: Longer response times between messages.
Repeated status requests: Questions being asked repeatedly because answers were lost in threads.
Context re-explanation: Customers re-explaining their situation from scratch.
Why Most Churn Detection Systems Have a Structural Blind Spot
Most churn detection happens in CRM dashboards, customer success platforms, or through survey tools like NPS/CSAT. But in modern B2B environments, the actual coordination happens elsewhere: inside Slack, Email, WhatsApp, and Teams.
The gap between where conversations happen and where churn is tracked is where risk hides.
Survey-based monitoring (like NPS) captures lagging indicators. It is a static snapshot of how a customer felt in the past.
Signal-based monitoring captures behavioral patterns in real time. It detects the trajectory of the relationship while it is still salvageable.
One system waits for dissatisfaction; the other detects a negative trajectory before the customer even realizes they are frustrated.
What Is Non-Voluntary Customer Churn?
Voluntary Churn (The Product Problem)
This happens when a customer consciously decides your product no longer fits their needs. It is usually driven by pricing, feature gaps, or a lack of core product value.
Non-Voluntary Churn (The Systems Design Problem)
This happens when a customer loses confidence in your execution—not necessarily the product itself. They didn't come in planning to leave; they drifted away because small coordination failures compounded over time.
While voluntary churn is a product-market fit problem, non-voluntary churn is a systems design problem. And systems problems require systems solutions.
Why Hiring More CSMs Doesn’t Solve Non-Voluntary Churn
When churn metrics worsen, the reflex is often to add capacity: more CSMs, more escalation managers, more review meetings.
But adding people to a system where coordination signals are invisible does not reduce failure—it increases complexity.The real question isn’t “How many CSMs do we need?” The real question is “How many invisible coordination failures are happening per account per week?” If you don't fix the underlying data architecture, you are simply throwing more people into the black box.
A CTO Perspective on Execution Observability
In a recent review of cross-vendor coordination workflows, Jatin Jain, CTO at Spyne, shared an important leadership insight.
As he put it:
“As we scale, the complexity of coordination increases. Even when teams are responsive and committed, the real challenge is ensuring execution consistency and visibility across stakeholders in real time. We need systems that make customer sentiment and escalation signals visible and ensure responsiveness and ownership so businesses can fulfill their commitments within SLAs to their customers.”
Execution visibility, in other words, becomes a prerequisite for trust.
The 4-Stage Evolution of a Churn Signal
Stage 1: The Soft Check-In — Routine pings like “Just checking in” repeat across threads. This signals unresolved coordination loops.
Stage 2: Language Intensification — Tone shifts to “We need this urgently.” Escalation language frequency increases.
Stage 3: Ownership Ambiguity — Decision cycles slow down and stakeholder loops increase, but no one on your team clearly owns the next step.
Stage 4: Context Re-Explanation — The customer re-explains their situation from scratch. Your system has lost its historical memory.
Structural Comparison
Signal
What It Indicates
repeated follow-up messages
unresolved tasks or stalled progress
escalation language
rising urgency or frustration
delayed response times
execution slowdown
context re-explanation
breakdown in institutional memory
multiple stakeholders joining threads
ownership ambiguity
The Five Structural Changes That Prevent Non-Voluntary Churn
To catch coordination failure early, organizations must shift from reactive monitoring to proactive signal detection through five core capabilities:
Escalation Detection: Automated, semantic detection of friction within raw text.
Automatic Ownership Tracking: Making "responsibility drift" visible so every request has a deterministic owner.
Real-Time Risk Scoring: A dynamic score based on thread latency and stakeholder engagement.
Decision Traceability: A persistent record of commitments made in chat so the "Plan of Record" is never lost.
Structured Commitment Extraction: Identifying what was promised and tracking it against delivery.
Shifting from Basic Ticket Logging to a Unified Context Graph
Legacy ticketing software is built to close logs, not to parse intent. Technical leaders need an architecture that constructs continuous Organizational Memory.
To achieve this, the underlying data structure must shift. Instead of seeing isolated messages, teams utilize a Context Graph—a dynamic map of nodes and edges that links every Slack thread, email approval, and WhatsApp check-in into a single, addressable network.
Signal Analysis
Legacy Ticket Logging | Conversation Intelligence Layer |
Stateless Capture: Isolates messages into disconnected logs. | Stateful Context: Maps evolving relationships continuously via a Context Graph. |
Siloed Pipelines: Keeps Slack and email partitioned. | Unified Intelligence: Links multi-channel streams into one network. |
Surface Metrics: Measures by "volume closed." | Deep Intelligence: Surfaces Impact Events that predict churn. |
Conclusion: Building the Compounding Firm
Organizations that architect their data around conversation intelligence build a structural moat. By prioritizing this as a core piece of your technical infrastructure, you move your business away from fragile information silos and evolve into a compounding firm—one that scales efficiently through a resilient, shared, and fully unified institutional understanding.
Relationship-led firms will grow by compounding their shared understanding instead of outgrowing it.
FAQ: Understanding Non-Voluntary Churn
How is non-voluntary churn different from credit card failures?
In B2C, non-voluntary usually means billing issues. In B2B, we define it as execution failure. It's when a customer leaves because your internal coordination was so messy they lost trust in your ability to deliver.
Why is "Response Latency" a better predictor of churn than NPS?
Net Promoter Scores (NPS) are snapshots of how a customer feels at one moment. Response latency is a behavioral telemetry. When latency stretches, it shows a decline in priority that happens long before a customer gives you a low score on a survey.
Can't we just use our CRM to track these signals?
CRM systems rely on manual data entry. Most "coordination friction" happens in Slack or DMs and never makes it into the CRM. A conversation intelligence layer automatically extracts these signals from the source, removing the structural blind spot.
What is an "Impact Event"?
An Impact Event is any conversational pivot that changes the plan of record—a new feature request, a shifted deadline, or a stakeholder expressing a blocker. Tracking these as structured data ensures they are never lost during handoffs.
How does this help with team scaling?
Hiring more people often increases coordination complexity. By using a Unified Context Graph, you create "Organizational Memory." New hires can see the full history and intent of an account instantly, reducing the "Context Re-Explanation" phase that often drives customers away.

Blog written by
Animesh Srivastava
Co-founder
Animesh Srivastava is our Co-founder and engineer with a strong interest in data, systems design, and applied AI. He enjoys working at the intersection of patterns, system behaviour, and practical problem-solving.
Blog written by
Animesh Srivastava
Co-founder
Animesh Srivastava is our Co-founder and engineer with a strong interest in data, systems design, and applied AI. He enjoys working at the intersection of patterns, system behaviour, and practical problem-solving.
Every B2B enterprise tracks voluntary churn—the explicit, painful moment an account logs a cancellation request or jumps to a competitor. Because it is loud and definitive, it is easy to build a post-mortem around.
But there is a far more insidious, silent leak in your revenue engine: non-voluntary churn.
In traditional SaaS circles, non-voluntary churn is routinely misdiagnosed as simple transactional billing failure. But for relationship-led firms, managed services, and complex B2B ecosystems, true non-voluntary churn is an architectural pipeline failure. It happens when critical communication state is dropped, stakeholder connection maps dissolve, or institutional context is lost during team handoffs.
The customer didn't necessarily want to leave; your data infrastructure simply allowed the relationship to decay in an unstructured black box. To stop this leakage, leadership must move past surface-level logging and deploy dedicated customer conversation intelligence to reduce churn.
What the Data Shows: The Anatomy of a Decaying Account
After analyzing patterns across 3 million customer conversations spanning Slack, WhatsApp, and email, a consistent pattern emerged: Churn is rarely a sudden decision.
It appears first as coordination friction inside everyday conversations, often weeks before a formal churn discussion begins. Communication behavior often shifts in measurable ways:
Increased follow-up frequency: Clients sending pings because internal state hasn't moved.
Escalation language: The appearance of phrases like "critical," "urgent," or "blocker."
Latency drift: Longer response times between messages.
Repeated status requests: Questions being asked repeatedly because answers were lost in threads.
Context re-explanation: Customers re-explaining their situation from scratch.
Why Most Churn Detection Systems Have a Structural Blind Spot
Most churn detection happens in CRM dashboards, customer success platforms, or through survey tools like NPS/CSAT. But in modern B2B environments, the actual coordination happens elsewhere: inside Slack, Email, WhatsApp, and Teams.
The gap between where conversations happen and where churn is tracked is where risk hides.
Survey-based monitoring (like NPS) captures lagging indicators. It is a static snapshot of how a customer felt in the past.
Signal-based monitoring captures behavioral patterns in real time. It detects the trajectory of the relationship while it is still salvageable.
One system waits for dissatisfaction; the other detects a negative trajectory before the customer even realizes they are frustrated.
What Is Non-Voluntary Customer Churn?
Voluntary Churn (The Product Problem)
This happens when a customer consciously decides your product no longer fits their needs. It is usually driven by pricing, feature gaps, or a lack of core product value.
Non-Voluntary Churn (The Systems Design Problem)
This happens when a customer loses confidence in your execution—not necessarily the product itself. They didn't come in planning to leave; they drifted away because small coordination failures compounded over time.
While voluntary churn is a product-market fit problem, non-voluntary churn is a systems design problem. And systems problems require systems solutions.
Why Hiring More CSMs Doesn’t Solve Non-Voluntary Churn
When churn metrics worsen, the reflex is often to add capacity: more CSMs, more escalation managers, more review meetings.
But adding people to a system where coordination signals are invisible does not reduce failure—it increases complexity.The real question isn’t “How many CSMs do we need?” The real question is “How many invisible coordination failures are happening per account per week?” If you don't fix the underlying data architecture, you are simply throwing more people into the black box.
A CTO Perspective on Execution Observability
In a recent review of cross-vendor coordination workflows, Jatin Jain, CTO at Spyne, shared an important leadership insight.
As he put it:
“As we scale, the complexity of coordination increases. Even when teams are responsive and committed, the real challenge is ensuring execution consistency and visibility across stakeholders in real time. We need systems that make customer sentiment and escalation signals visible and ensure responsiveness and ownership so businesses can fulfill their commitments within SLAs to their customers.”
Execution visibility, in other words, becomes a prerequisite for trust.
The 4-Stage Evolution of a Churn Signal
Stage 1: The Soft Check-In — Routine pings like “Just checking in” repeat across threads. This signals unresolved coordination loops.
Stage 2: Language Intensification — Tone shifts to “We need this urgently.” Escalation language frequency increases.
Stage 3: Ownership Ambiguity — Decision cycles slow down and stakeholder loops increase, but no one on your team clearly owns the next step.
Stage 4: Context Re-Explanation — The customer re-explains their situation from scratch. Your system has lost its historical memory.
Structural Comparison
Signal
What It Indicates
repeated follow-up messages
unresolved tasks or stalled progress
escalation language
rising urgency or frustration
delayed response times
execution slowdown
context re-explanation
breakdown in institutional memory
multiple stakeholders joining threads
ownership ambiguity
The Five Structural Changes That Prevent Non-Voluntary Churn
To catch coordination failure early, organizations must shift from reactive monitoring to proactive signal detection through five core capabilities:
Escalation Detection: Automated, semantic detection of friction within raw text.
Automatic Ownership Tracking: Making "responsibility drift" visible so every request has a deterministic owner.
Real-Time Risk Scoring: A dynamic score based on thread latency and stakeholder engagement.
Decision Traceability: A persistent record of commitments made in chat so the "Plan of Record" is never lost.
Structured Commitment Extraction: Identifying what was promised and tracking it against delivery.
Shifting from Basic Ticket Logging to a Unified Context Graph
Legacy ticketing software is built to close logs, not to parse intent. Technical leaders need an architecture that constructs continuous Organizational Memory.
To achieve this, the underlying data structure must shift. Instead of seeing isolated messages, teams utilize a Context Graph—a dynamic map of nodes and edges that links every Slack thread, email approval, and WhatsApp check-in into a single, addressable network.
Signal Analysis
Legacy Ticket Logging | Conversation Intelligence Layer |
Stateless Capture: Isolates messages into disconnected logs. | Stateful Context: Maps evolving relationships continuously via a Context Graph. |
Siloed Pipelines: Keeps Slack and email partitioned. | Unified Intelligence: Links multi-channel streams into one network. |
Surface Metrics: Measures by "volume closed." | Deep Intelligence: Surfaces Impact Events that predict churn. |
Conclusion: Building the Compounding Firm
Organizations that architect their data around conversation intelligence build a structural moat. By prioritizing this as a core piece of your technical infrastructure, you move your business away from fragile information silos and evolve into a compounding firm—one that scales efficiently through a resilient, shared, and fully unified institutional understanding.
Relationship-led firms will grow by compounding their shared understanding instead of outgrowing it.
FAQ: Understanding Non-Voluntary Churn
How is non-voluntary churn different from credit card failures?
In B2C, non-voluntary usually means billing issues. In B2B, we define it as execution failure. It's when a customer leaves because your internal coordination was so messy they lost trust in your ability to deliver.
Why is "Response Latency" a better predictor of churn than NPS?
Net Promoter Scores (NPS) are snapshots of how a customer feels at one moment. Response latency is a behavioral telemetry. When latency stretches, it shows a decline in priority that happens long before a customer gives you a low score on a survey.
Can't we just use our CRM to track these signals?
CRM systems rely on manual data entry. Most "coordination friction" happens in Slack or DMs and never makes it into the CRM. A conversation intelligence layer automatically extracts these signals from the source, removing the structural blind spot.
What is an "Impact Event"?
An Impact Event is any conversational pivot that changes the plan of record—a new feature request, a shifted deadline, or a stakeholder expressing a blocker. Tracking these as structured data ensures they are never lost during handoffs.
How does this help with team scaling?
Hiring more people often increases coordination complexity. By using a Unified Context Graph, you create "Organizational Memory." New hires can see the full history and intent of an account instantly, reducing the "Context Re-Explanation" phase that often drives customers away.
Blog written by
Animesh Srivastava
Co-founder
Animesh Srivastava is our Co-founder and engineer with a strong interest in data, systems design, and applied AI. He enjoys working at the intersection of patterns, system behaviour, and practical problem-solving.