Implementing Context Graphs: A Step-by-Step Guide to the Open Source py-context-graph Pipeline
Implementing Context Graphs: A Step-by-Step Guide to the Open Source py-context-graph Pipeline

In our previous post, we discussed why organisations “forget” decisions and how a Context Graph can fix it. Today, we’re opening the hood. We’re going to implement a decision trace pipeline using py-context-graph — our newly open-sourced framework that turns messy conversations into a queryable, connected graph.
Built by our team and released for the developer community, py-context-graph helps organisations transform unstructured conversations into structured decision intelligence.
Why We Open-Sourced py-context-graph
Losing context is not a niche workflow issue — it is a fundamental operating problem. Teams lose decision history. Software loses continuity. AI systems lose memory between interactions.
Because this challenge extends far beyond any one platform, we chose to open-source py-context-graph so others can build on a shared foundation for context-aware systems.In our previous post, we discussed why organizations “forget” decisions and how a Context Graph can fix it. Today, we’re opening the hood. We’re going to implement a decision trace pipeline using py-context-graph—the engine that turns messy conversations into a queryable, connected graph.
The Goal
By the end of this guide, you will have a running system that can ingest conversation data (Slack, WhatsApp, or meeting notes), extract structured decisions, and visualize them in an interactive graph.
Setting Up the Engine
To facilitate the analysis of your conversation archives, we must first initialize the local environment. This process has been automated via a Makefile to ensure a seamless, low-touch configuration.
Step 1: Clone and Enter the Lab
First, grab the source code and move into the project root. This is where the core logic and orchestration layers live.
git clone https://github.com/ResearchifyLabs/py-context-graph.git
cd py-context-graphStep 2: Step into the Environment
Activate the virtual environment that the
makecommand just built for you. This ensures the script uses the correct local versions of our libraries.for Mac:
source .venv/bin/activatefor Windows:
.venv\Scripts\activate.batStep 3: Authenticate the Brain
The pipeline needs an LLM to act as the “reasoning engine.” Export your API key to your environment. While we support various providers via LiteLLM, OpenAI is the default for the demo.
for Mac:
export OPENAI_API_KEY=<YOUR_KEY_HERE>for Windows:
set OPENAI_API_KEY=YOUR_KEY_HERE
Step 4: The “One-Command” Install
Instead of wrestling with manual dependency versions, we use a development target. This command automatically creates a virtual environment (
.venv) and installs all necessary extras (LLM adapters, vector stores, and visualization tools).for Mac:
make install-devfor Windows:
pip install -e ".[dev]"
Step 5: Fire Up the Demo
Now, move into the
examplesdirectory and run the engine. This will trigger the extraction pipeline on the sample data and launch your interactive dashboard.
cd examples
python run.pyOnce you run that last command, the terminal will give you a local URL (
http://localhost:8888/viewer.html). That is your gateway to the Context Graph.
Decoding the Implementation ( Visaulizing the Graph )
Once your local server is initialized, navigating to the provided URL ( http://localhost:8888/viewer.html) brings you to the Interactive Demo landing page. This is the entry point where unstructured communication begins its transformation into a structured Decision Trace.
Navigating the Demo Interface
The interface is designed for immediate experimentation, offering two distinct workflows: processing bundled samples or uploading custom .txt and .md files. To understand how the pipeline identifies overlapping decisions across multiple days, we recommend starting with the provided samples.
Initiating the Pipeline
To witness the “Aha!” moment where text becomes a queryable graph, follow these steps:
Select Conversations: Under the “Run Demo Conversations” section, select one or more of the bundled sample files (e.g.,
sample_conversation_1.txt). These contain simulated team standups with complex, interconnected decisions.Execute the Engine: Click the Run Demo button.
At this point, the background process triggers the extraction and enrichment pipeline. The engine parses the text, calls the LLM to identify decision units, and begins materializing the clusters that form your Context Graph. Within seconds, the view will transition from this landing page to the comprehensive Decision Intelligence Dashboard.
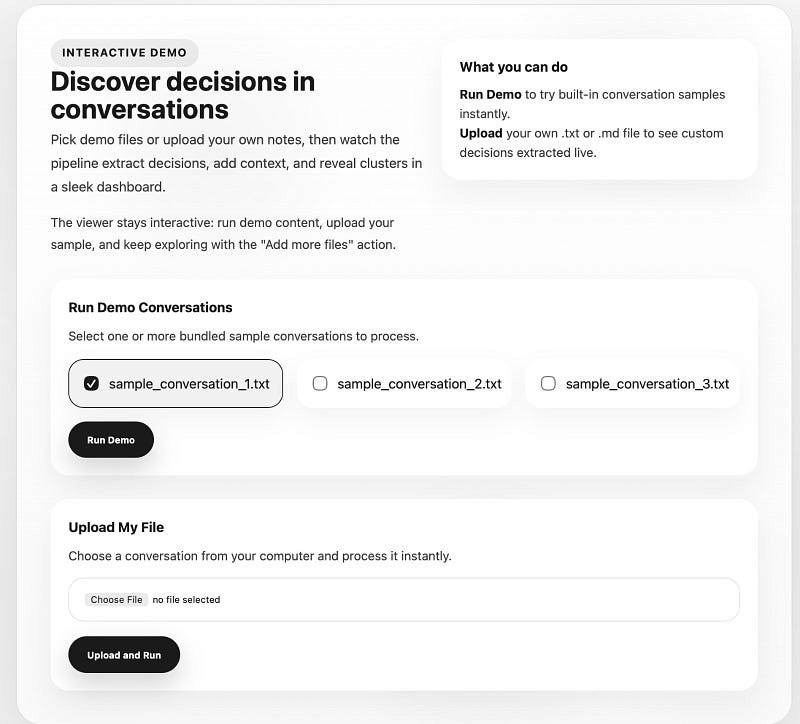
Figure 1: The py-context-graph landing page. From here, you can select bundled samples or upload your own conversation logs to initiate the extraction pipeline.
The Execution Phase: Inside the Pipeline
Once you click “Run Demo,” the system transitions from ingestion to active processing. This isn’t a simple, one-step conversion; it is a sophisticated, multi-stage workflow where conversation intelligence systematically breaks down raw text into a structured, interconnected context graph.
As the pipeline runs, you can monitor the five critical stages of the decision trace lifecycle:
Extract: The LLM parses the conversation to identify specific decision units, initiators, and outcomes.
Persist: The extracted data is committed to the storage backend (In-Memory or Firestore).
Deduplicate: The system compares new traces against existing records to ensure that recurring discussions about the same topic don’t create “noise” in your organizational memory.
Enrich: This adds a layer of metadata — automatically tagging entities, topics, and constraints that provide the “why” behind the “what.”
Cluster: Finally, individual traces are grouped by semantic similarity, forming the thematic nodes of your context graph.
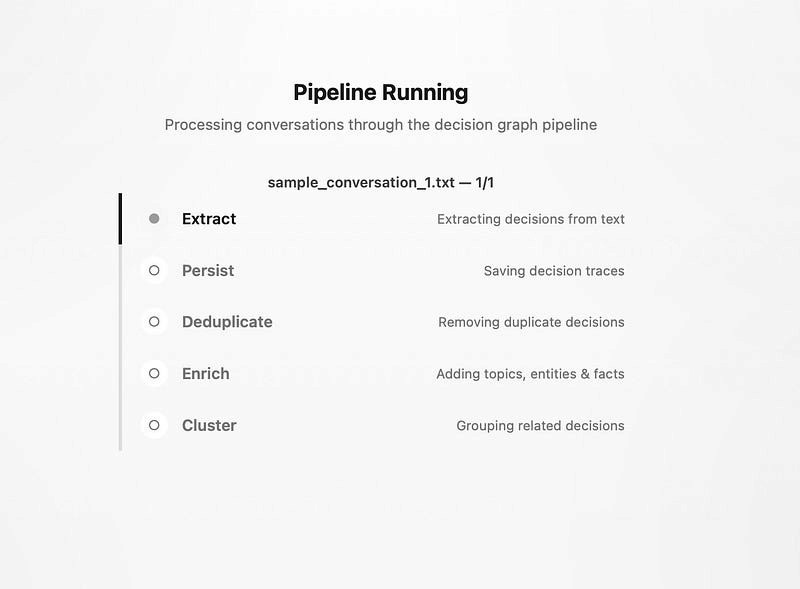
Figure 2: The conversation intelligence pipeline in motion. This sequential workflow ensures that every decision trace is cleaned, enriched, and properly positioned within the larger context graph.
From Raw Data to Clarity: Interpreting Your Results
Once the pipeline completes, the Insights Dashboard transforms raw logs into a high-fidelity map of your organisational health.
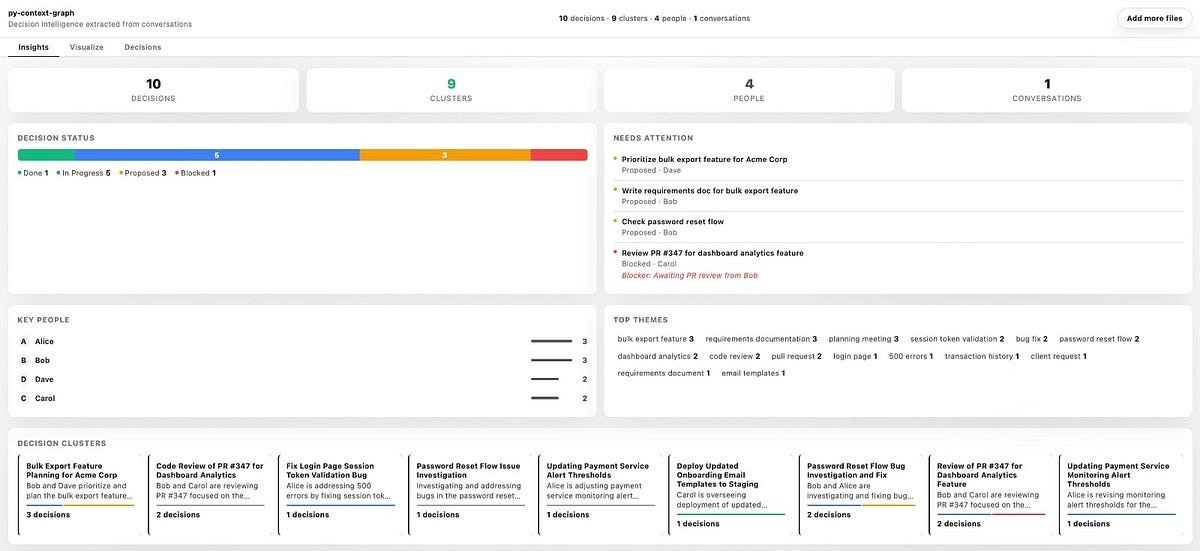
Figure 3: The Insights dashboard provides a bird’s-eye view of your decision landscape and project health.
Here is a breakdown of the four key blocks that define your output:
Decision Status: A visual health check of the organisation’s progress, categorising every trace into states like “Done,” “In Progress,” “Proposed,” or “Blocked.”
Key People: This block identifies the most active decision-makers, providing a quantitative look at who is initiating and driving actions across the graph.
Top Themes: A frequency map of automatically extracted keywords that surfaces the dominant topics currently trending in team discussions.
Decision Clusters: Semantic groupings that tie individual traces together into cohesive project themes, making complex, multi-day threads easy to follow at a glance.
The Visual Layer: Navigating the Context Graph
Move beyond the dashboard summaries by clicking the Visualize tab. This is where the abstract theory of decision tracesbecomes a tangible, interactive reality. The “Explore” view provides a living map of your organization’s logic — what we call the context graph.
Anatomy of a Node
The graph uses a specific visual language to help you identify patterns at a glance:
Diamonds (Clusters): These are the high-level thematic hubs (e.g., “API Migration” or “Budget Review”) that group related decisions together.
Dots (Decisions): The core units of action. Their color tells you the story: Green is Done, Blue is In Progress, and Red is a Blocker.
Stars (People): The individuals who initiated or approved the traces, showing you who the key stakeholders are for any given topic.
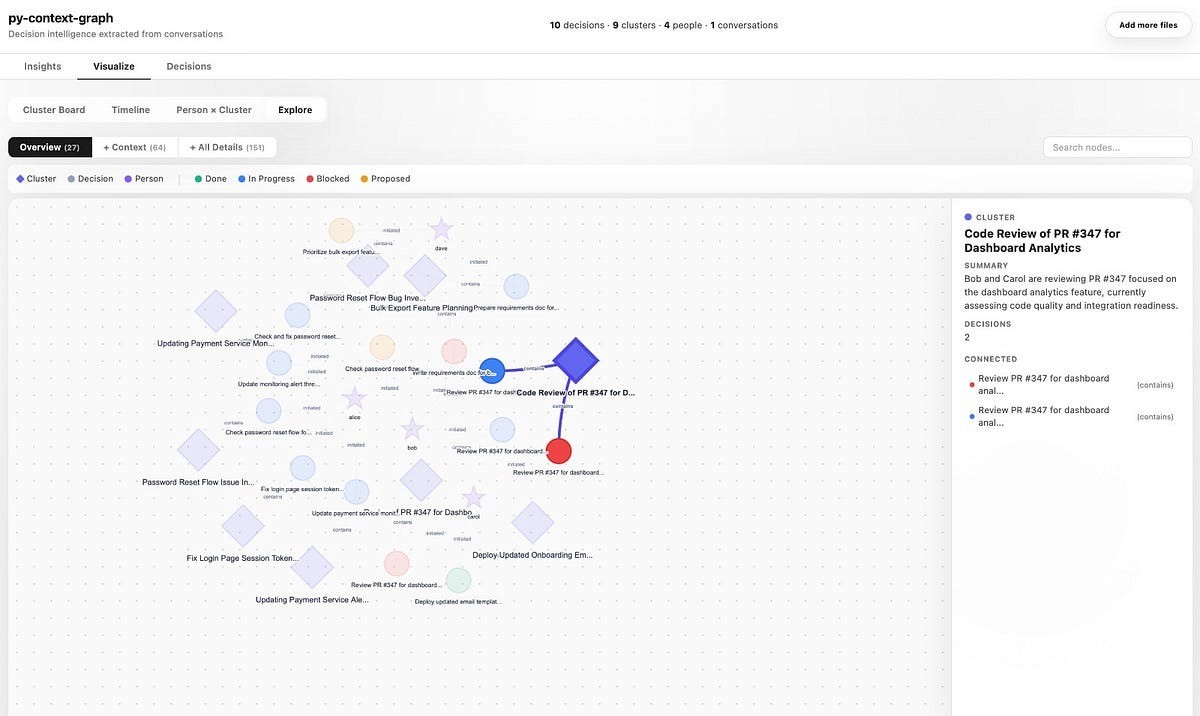
Figure 4: The “Explore” view materializes your organization’s logic into an interactive, force-directed graph where you can drill down into any node for full context.
Deep Context on Demand
The implementation is highly interactive. When you click on any node — like a specific Decision Cluster — the sidebar instantly populates with a deep-dive summary. It reveals the underlying decision traces, the people involved, and the status of each component.
You can also toggle between different perspectives to suit your needs:
Cluster Board: A structured grid of thematic workstreams.
Timeline: A chronological view of how decisions evolved.
Person x Cluster: A matrix showing which team members are driving specific projects.
Explore: The full, force-directed graph for discovering hidden dependencies.
Bringing Order to the Chaos: Conclusion
Organizations don’t have an information problem; they have a context problem. Conversations move fast, and without a structured way to capture the “why” behind every action, critical decisions eventually evaporate into the archives of Slack and email.
In this guide, we’ve walked through the practical implementation of py-context-graph — from setting up the engine to visualizing the intricate web of your organization’s logic. We’ve seen how conversation intelligence can:
Identify and extract hidden decision traces.
Deduplicate and enrich raw text with thematic context.
Materialize a living context graph that makes your organizational memory queryable.
Start Building Today
The implementation we’ve explored is just the beginning. The pipeline is designed to be pluggable and extensible, allowing you to adapt the storage, LLM, and graph layers to your specific business needs.
We have officially open-sourced the core engine, and you can get started right now:
📦 PyPI: py-context-graph
💻 GitHub: ResearchifyLabs/py-context-graph
Beyond the Open Source
At Chetto, our work is centered on “conversation intelligence.” The open-source py-context-graph library is the same foundational logic that powers our broader platform, helping teams bridge the gap between talking about work and actually getting it done.
Whether you are building a custom internal tool or looking to gain visibility into your team’s blind spots, the path from unstructured noise to structured clarity starts with a single node.
FAQ's
What is conversation intelligence?
Conversation intelligence is the process of turning everyday communication—meetings, chats, emails, and message logs—into structured insights that teams can use to understand decisions, risks, commitments, and progress.
Why does conversation intelligence matter?
Modern work happens across fragmented communication channels. Important context often gets buried inside Slack threads, WhatsApp groups, meetings, and inboxes. Conversation intelligence helps teams surface what matters before issues escalate.
Is Chetto open source?
Chetto’s core platform is proprietary, but we actively open-source selected tools and infrastructure that help developers build conversation intelligence systems.
What is py-context-graph?
py-context-graph is an open-source Python library that converts unstructured conversations into a structured context graph. It helps teams map people, decisions, blockers, themes, and relationships across communication data.
How does py-context-graph support conversation intelligence?
py-context-graph is an infrastructure layer for conversation intelligence. It turns extracted signals from conversations into connected nodes and relationships that can be searched, queried, and analyzed over time.

Blog written by
Animesh Srivastava
Co-founder
Animesh Srivastava is our Co-founder and engineer with a strong interest in data, systems design, and applied AI. He enjoys working at the intersection of patterns, system behaviour, and practical problem-solving.
Blog written by
Animesh Srivastava
Co-founder
Animesh Srivastava is our Co-founder and engineer with a strong interest in data, systems design, and applied AI. He enjoys working at the intersection of patterns, system behaviour, and practical problem-solving.
In our previous post, we discussed why organisations “forget” decisions and how a Context Graph can fix it. Today, we’re opening the hood. We’re going to implement a decision trace pipeline using py-context-graph — our newly open-sourced framework that turns messy conversations into a queryable, connected graph.
Built by our team and released for the developer community, py-context-graph helps organisations transform unstructured conversations into structured decision intelligence.
Why We Open-Sourced py-context-graph
Losing context is not a niche workflow issue — it is a fundamental operating problem. Teams lose decision history. Software loses continuity. AI systems lose memory between interactions.
Because this challenge extends far beyond any one platform, we chose to open-source py-context-graph so others can build on a shared foundation for context-aware systems.In our previous post, we discussed why organizations “forget” decisions and how a Context Graph can fix it. Today, we’re opening the hood. We’re going to implement a decision trace pipeline using py-context-graph—the engine that turns messy conversations into a queryable, connected graph.
The Goal
By the end of this guide, you will have a running system that can ingest conversation data (Slack, WhatsApp, or meeting notes), extract structured decisions, and visualize them in an interactive graph.
Setting Up the Engine
To facilitate the analysis of your conversation archives, we must first initialize the local environment. This process has been automated via a Makefile to ensure a seamless, low-touch configuration.
Step 1: Clone and Enter the Lab
First, grab the source code and move into the project root. This is where the core logic and orchestration layers live.
git clone https://github.com/ResearchifyLabs/py-context-graph.git
cd py-context-graphStep 2: Step into the Environment
Activate the virtual environment that the
makecommand just built for you. This ensures the script uses the correct local versions of our libraries.for Mac:
source .venv/bin/activatefor Windows:
.venv\Scripts\activate.batStep 3: Authenticate the Brain
The pipeline needs an LLM to act as the “reasoning engine.” Export your API key to your environment. While we support various providers via LiteLLM, OpenAI is the default for the demo.
for Mac:
export OPENAI_API_KEY=<YOUR_KEY_HERE>for Windows:
set OPENAI_API_KEY=YOUR_KEY_HERE
Step 4: The “One-Command” Install
Instead of wrestling with manual dependency versions, we use a development target. This command automatically creates a virtual environment (
.venv) and installs all necessary extras (LLM adapters, vector stores, and visualization tools).for Mac:
make install-devfor Windows:
pip install -e ".[dev]"
Step 5: Fire Up the Demo
Now, move into the
examplesdirectory and run the engine. This will trigger the extraction pipeline on the sample data and launch your interactive dashboard.
cd examples
python run.pyOnce you run that last command, the terminal will give you a local URL (
http://localhost:8888/viewer.html). That is your gateway to the Context Graph.
Decoding the Implementation ( Visaulizing the Graph )
Once your local server is initialized, navigating to the provided URL ( http://localhost:8888/viewer.html) brings you to the Interactive Demo landing page. This is the entry point where unstructured communication begins its transformation into a structured Decision Trace.
Navigating the Demo Interface
The interface is designed for immediate experimentation, offering two distinct workflows: processing bundled samples or uploading custom .txt and .md files. To understand how the pipeline identifies overlapping decisions across multiple days, we recommend starting with the provided samples.
Initiating the Pipeline
To witness the “Aha!” moment where text becomes a queryable graph, follow these steps:
Select Conversations: Under the “Run Demo Conversations” section, select one or more of the bundled sample files (e.g.,
sample_conversation_1.txt). These contain simulated team standups with complex, interconnected decisions.Execute the Engine: Click the Run Demo button.
At this point, the background process triggers the extraction and enrichment pipeline. The engine parses the text, calls the LLM to identify decision units, and begins materializing the clusters that form your Context Graph. Within seconds, the view will transition from this landing page to the comprehensive Decision Intelligence Dashboard.
Figure 1: The py-context-graph landing page. From here, you can select bundled samples or upload your own conversation logs to initiate the extraction pipeline.
The Execution Phase: Inside the Pipeline
Once you click “Run Demo,” the system transitions from ingestion to active processing. This isn’t a simple, one-step conversion; it is a sophisticated, multi-stage workflow where conversation intelligence systematically breaks down raw text into a structured, interconnected context graph.
As the pipeline runs, you can monitor the five critical stages of the decision trace lifecycle:
Extract: The LLM parses the conversation to identify specific decision units, initiators, and outcomes.
Persist: The extracted data is committed to the storage backend (In-Memory or Firestore).
Deduplicate: The system compares new traces against existing records to ensure that recurring discussions about the same topic don’t create “noise” in your organizational memory.
Enrich: This adds a layer of metadata — automatically tagging entities, topics, and constraints that provide the “why” behind the “what.”
Cluster: Finally, individual traces are grouped by semantic similarity, forming the thematic nodes of your context graph.
Figure 2: The conversation intelligence pipeline in motion. This sequential workflow ensures that every decision trace is cleaned, enriched, and properly positioned within the larger context graph.
From Raw Data to Clarity: Interpreting Your Results
Once the pipeline completes, the Insights Dashboard transforms raw logs into a high-fidelity map of your organisational health.
Figure 3: The Insights dashboard provides a bird’s-eye view of your decision landscape and project health.
Here is a breakdown of the four key blocks that define your output:
Decision Status: A visual health check of the organisation’s progress, categorising every trace into states like “Done,” “In Progress,” “Proposed,” or “Blocked.”
Key People: This block identifies the most active decision-makers, providing a quantitative look at who is initiating and driving actions across the graph.
Top Themes: A frequency map of automatically extracted keywords that surfaces the dominant topics currently trending in team discussions.
Decision Clusters: Semantic groupings that tie individual traces together into cohesive project themes, making complex, multi-day threads easy to follow at a glance.
The Visual Layer: Navigating the Context Graph
Move beyond the dashboard summaries by clicking the Visualize tab. This is where the abstract theory of decision tracesbecomes a tangible, interactive reality. The “Explore” view provides a living map of your organization’s logic — what we call the context graph.
Anatomy of a Node
The graph uses a specific visual language to help you identify patterns at a glance:
Diamonds (Clusters): These are the high-level thematic hubs (e.g., “API Migration” or “Budget Review”) that group related decisions together.
Dots (Decisions): The core units of action. Their color tells you the story: Green is Done, Blue is In Progress, and Red is a Blocker.
Stars (People): The individuals who initiated or approved the traces, showing you who the key stakeholders are for any given topic.
Figure 4: The “Explore” view materializes your organization’s logic into an interactive, force-directed graph where you can drill down into any node for full context.
Deep Context on Demand
The implementation is highly interactive. When you click on any node — like a specific Decision Cluster — the sidebar instantly populates with a deep-dive summary. It reveals the underlying decision traces, the people involved, and the status of each component.
You can also toggle between different perspectives to suit your needs:
Cluster Board: A structured grid of thematic workstreams.
Timeline: A chronological view of how decisions evolved.
Person x Cluster: A matrix showing which team members are driving specific projects.
Explore: The full, force-directed graph for discovering hidden dependencies.
Bringing Order to the Chaos: Conclusion
Organizations don’t have an information problem; they have a context problem. Conversations move fast, and without a structured way to capture the “why” behind every action, critical decisions eventually evaporate into the archives of Slack and email.
In this guide, we’ve walked through the practical implementation of py-context-graph — from setting up the engine to visualizing the intricate web of your organization’s logic. We’ve seen how conversation intelligence can:
Identify and extract hidden decision traces.
Deduplicate and enrich raw text with thematic context.
Materialize a living context graph that makes your organizational memory queryable.
Start Building Today
The implementation we’ve explored is just the beginning. The pipeline is designed to be pluggable and extensible, allowing you to adapt the storage, LLM, and graph layers to your specific business needs.
We have officially open-sourced the core engine, and you can get started right now:
📦 PyPI: py-context-graph
💻 GitHub: ResearchifyLabs/py-context-graph
Beyond the Open Source
At Chetto, our work is centered on “conversation intelligence.” The open-source py-context-graph library is the same foundational logic that powers our broader platform, helping teams bridge the gap between talking about work and actually getting it done.
Whether you are building a custom internal tool or looking to gain visibility into your team’s blind spots, the path from unstructured noise to structured clarity starts with a single node.
FAQ's
What is conversation intelligence?
Conversation intelligence is the process of turning everyday communication—meetings, chats, emails, and message logs—into structured insights that teams can use to understand decisions, risks, commitments, and progress.
Why does conversation intelligence matter?
Modern work happens across fragmented communication channels. Important context often gets buried inside Slack threads, WhatsApp groups, meetings, and inboxes. Conversation intelligence helps teams surface what matters before issues escalate.
Is Chetto open source?
Chetto’s core platform is proprietary, but we actively open-source selected tools and infrastructure that help developers build conversation intelligence systems.
What is py-context-graph?
py-context-graph is an open-source Python library that converts unstructured conversations into a structured context graph. It helps teams map people, decisions, blockers, themes, and relationships across communication data.
How does py-context-graph support conversation intelligence?
py-context-graph is an infrastructure layer for conversation intelligence. It turns extracted signals from conversations into connected nodes and relationships that can be searched, queried, and analyzed over time.
Blog written by
Animesh Srivastava
Co-founder
Animesh Srivastava is our Co-founder and engineer with a strong interest in data, systems design, and applied AI. He enjoys working at the intersection of patterns, system behaviour, and practical problem-solving.